
Break-even analysis helps to calculating and examining the margin of safety of a business based on the revenues collected and associated costs. In other words, the break-even analysis shows how many sales it takes to pay for the cost of doing business.
What you are going to learn?
What is Break-even Analysis?
Revenue and cost can be studied by examining the total revenue and total cost of a business. Break-even Analysis implies that at some point in the operations, total revenue has to be equals to the total cost.
basically, break-even analysis is concerned with finding the point at which revenues and cost agree exactly, hence the point termed as Breakeven point. That means, the volume of output at which neither a profit is made nor a loss incurred.
Break-even analysis can be performed algebraically or graphically.
Importance of Break-even Analysis
- Break-even analysis helps to find out What volume of sale will be necessary to cover
- a reasonable return on capital employed,
- preference and ordinary dividends, and
- reserves.
- It helps to calculate costs and revenues for all possible output volume to fix the budgeted sales.
- Helps to determine variable cost per unit.
- Break-even analysis can compare business enterprises by arranging their earnings.
Break-even Analysis formula
The Break-even point can be calculated by using the following formula-
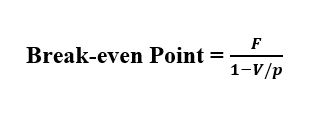
Where, F = Fixed cost,
V = Variable cost per unit or total variable cost
P = selling price of each unit or total sales value.
.
Example of break-even analysis:
Fixed cost of a business is $8,00,000. Variable cost per unit is $40, and each unit sells at 200.
In this case, F = 8,00,000 V = 40 and P = 200
So, using the equation, Break-even Point = 800000/ (1- 40/200) = $ 10,00,000.
Download Break-even analysis pdf |Break-even chart pdf
Break-even Chart
A Break-even chart is the graphical representation of the relation between cost and revenue at a given time. It is a graphic tool to determine the Break-even point and profit potential under the varying condition of output and costs.
In 1930 Walter Rautenstruch an Industrial engineer and a professor of Columbia university, invented the Break-even chart.
It was the first planning tools that become available to production management and management accountancy. Some modifications have been done on that chart and now it becomes a more useful tool for the production management field.
Functions of Break-even Chart
- A break-even chart gives a clearer view of the position of a business.
- It is one of the most useful graphic presentations of an economic rather than an accounting concept.
- It portrays profit or loss at various output levels.
- Break-even chart marks no profit no loss situation or Break-even point.
- It portrays the margin of safety.
- It can help to make specific plans to affect the profits through the control of expenses.
- This chart can sum up the impact of alternative decisions on costs and profits.
- It is a decision-making tool in the hand of management.
Construction of Break-even chart
The figure below portraying construction of Break-even chart.

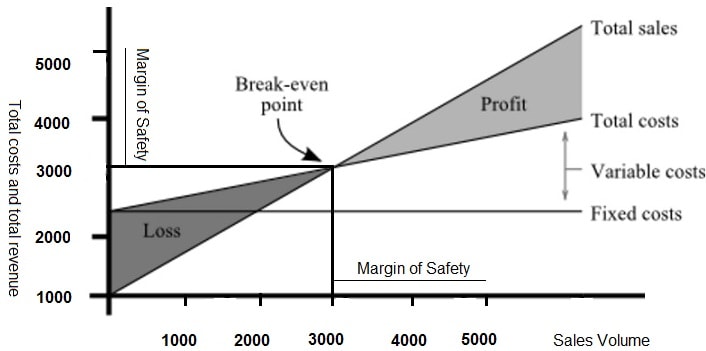
The Break-even chart consists of an ordinate (y-axis) which representing total cost and total revenue, And abscissa (x-axis) representing units of output or sales volume and number of unit produced.
There are 3 lines marked as a,b and c on the breakeven chart.
Line ‘a’ representing fixed cost function, fixed cost doesn’t change with the increase of sales volume.
Line ‘b’ representing the total cost which is an increasing linear, monotonic function that increases with an increasing volume of production. Total cost results from the summation of fixed costs and variable costs.
line ‘c’ represents sells revenue line or total sales, this line shows the income at varying levels of output or production volume.
Analysis of break-even Chart
- The breakeven point making no profit and no loss situation occurs for a given volume of production.
- The grey area between the total cost line and total sales revenue line on the left side of the breakeven point marks loss to the concern. The grey area between the same lines on the right side of the break-even point represents the profit.
- the profit comes only when more than a minimum volume of output is reached and profit increases at a faster rate than the increase of the total costs.
- Profit margin % = 1- (variable cost / sale)
- Where, sale = fixed cost + Variable cost as a % of the sale.
- Effect of increase in fixed costs (because of purchasing new machines) increase the total cost, thus Break-even point shifts towards the right-hand side. that means the company’s profit position will be impaired. So, management should study the market before purchasing new equipment.
- The effect of an increase in variable costs (hire new of labour) increases the total cost, which would shift the break-even point towards the right-hand side. That decrease the profit for the same unit of output.
- Effect of increase in sales price shifts the breakeven point towards the left-hand side. it increases the company’s profit for the same volume of output.
Margin of safety
the margin of safety presented on the Breakeven chart by the distance between break-even point and the production output as shown in the chart.
A large distance indicates that profit will be there even if there is a serious drop in production. If the distance is relatively small, it indicates profit will be reduced considerably with a sign of a small drop in productive capacity or sales.
Angle of incidence
Angle of incidence is the angle at which sales revenue line cuts the total cost line. A large angle indicates that profit making at a high rate.
High margin of safety with a large incidence angle are indication of favorable business position.
Limitations of break-even chart
- The Break-even point is difficult to determine in many cases due to market condition may not remain constant over the range of projected capacity.
- The total cost line representing the summation of variable costs and fixed costs need to be a straight line, but actual costs do not usually vary in direct proportion.
- A Breakeven chart represents a static figure, whereas business operations are not static.
- The Break-even analysis chart presents difficulties when an enterprise produces a variety of products.
Related terms
What is Cost?
Cost is the monetary value that every business has spent to produce some product and service.
In every business, the cost is the monetary valuation of raw materials, time, effort, and other resources that are used to make the product.
What is Revenue?
Revenue is the total money generated by selling goods within a specific time, before dedicated any expenses. It is the gross income by which costs are subtracted to determine the net income.
Fixed Cost
Fixed cost does not change with an increase or decrease in the number of goods or services sold. Fixed costs are expenses that must be paid by an enterprise. Fixes cost is independent of any specific business activities and does not change with the production level.
Variable Cost
Variable costs are a corporate expense that changes in proportion to production output. Variable costs increase or decrease depending on a company’s production volume, which means they rise as production increases and fall as production decreases.
2 thoughts on “What is Break-even Analysis? |Break-even Chart, pdf”